BIDU – Wrapping Up The Trade
A quick followup on my two previous trade posts related to BIDU.
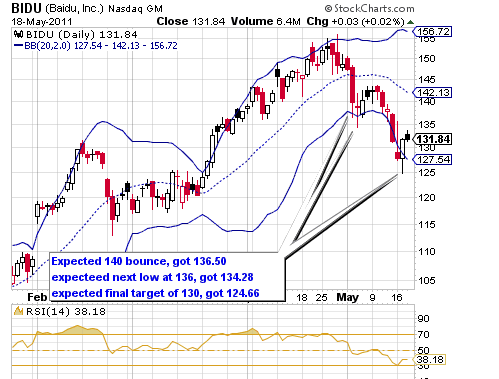
Based on divergence of the price and rsi and stochastics, we felt the stock was due for a correction. Using Elliott Wave analysis and resistance points, we expect a correction down to 140, then 136, with an ultimate target of 130.
We were wrong on the exact areas at which the price bounced, but we nailed the general trend. We held on all the way down a little past our target, 130. The stop actually went all the way down to 124.66, but we did not get that exit price. We exited at 127.40. Based on our original price of 145.71, published on April 15, we made 12.5%. Not bad for a few minutes of monitoring each day, and a month's patience.
By the way, we later re-established a position shorting BIDU. Based on our analysis of RSI strengths and resistance levels, we believe the stock will finally settle around $100. We expect at least one large bounce in between, at the 120 level.
This trade shows the importance of paying attention to technicals, but not putting too much credence in their precision. The Elliott Wave pattern worked, but it did not conform to a strict Fibonacci sequence. Resistance levels such as floors and ceilings should be taken loosely, not tightly. Thus we will not be surprised if BIDU later bounces at 97, and not at the 100 we predict. If that 3 percent difference makes or breaks your profitability, you should not take the trade in the first place.
As always, please read our disclaimer.