-
-
Let me start out by saying, I'm a huge NVDA bull. I think the company is very well run, and will remain the dominant player in the most important sector in global finance for the next 2 decades: Artificial Intelligence.
That said, NVDA's meteoric rise of more than 10x in the last 20 months from $15 to $140 is WAAAYYY overdone. We've already seen a dramatic correction, back down to $109 at today's price. I took a look at the technical indicators to see what story they told me. -
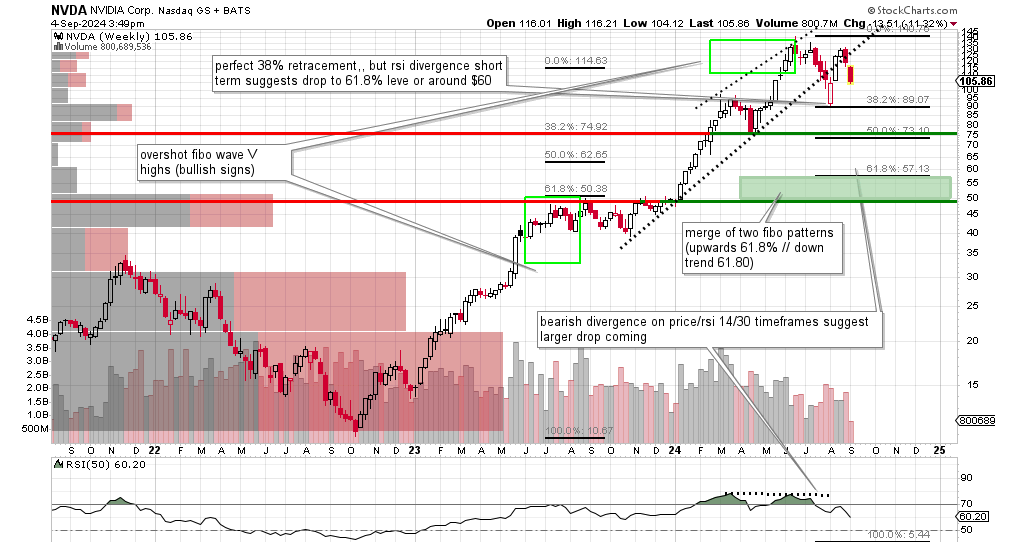
Look at this long term graph, featuring weekly candles. Notice a couple of things:
1) the fact that NVDA reached interim highs 2 times that surpassed the expected Fibonacci sequence by a large margin (see green boxes representing the overshoot) is the sign of a very bullish stock.
2) OK, but we've already had a picture perfect retracement by 38.2% to the $89 price. So this could be the "needed" drop and the Elliot Wave believers would be satisfied and happily tell you the stock can now move higher. .
I agree...except...
3) Take a look at that divergence between price and the RSI 50. That's a compelling argument that the air is out of this rally and further consolidation is needed. If you were to do an RSI trace you would see that that suggests a drop to levels last reached in Jan of 2024. That's at a floor of $51.
That level also would represent a 61.8% drop off the total up move since its low. That's a Fibonacci sequence that is very commonly seen playing a big role in stock patterns. It also coincides with the pivot point shown in green and red horizontal line established by all the price action in last 2023. This is where the majority of trades happened so the support there is psychologically very strong.
But that's about another halving off of current levels. What could promote such an enormous drop in what is still an extremely profitable company growing at a breakneck speed. NVDA admittedly has the best technology on the planet in a booming field of endeavor that I believe will be at the heart of all global growth in the future.Well so did Amazon in 2008. That did not prevent if from dropping by 80% in a year. NVDA's price/earnings ratio is still in nose-bleed territory. Furthermore, we're entering a period of a deepening recesson that is marked by political turmoil on a national and international level that is almost unprecedented since the late 1930's. Look what happened there.
For those of you that share my pessimism, I've fashioned a very sweet trades. For every $170 you put at risk you stand to make up to $1750. If you want to know how I'm doing that, I offer guidance that will set you back $25. Only purchase it if you are already set up to trade options through your broker, with the ability to put on calendar and other defined-risk trades. I look forward to seeing you in the forum.
Happy trading!
New Users Register here
Existing users can login at bottom of this page