08 April 2020 - Year of the Coronavirus
The United States Oil Fund (USO) offers us a very attractive trade today. With the corona virus raging, oil demand has plummeted. This is turn has sent oil prices dramatically lower, and caused discord to erupt among the major producers: Saudi Arabia, Russia, and the US fracking industry. Instead of lowering production to try to bring prices of crude oil in alignment with demand, these three groups have been exacerbating the problem. increasing production levels, to try to make up in volume what they are losing in price.
click to enlarge
The pain has been felt by all producers. Government budgets are reeling from a lack of funds, while the US oil industry is facing a deluge of bankruptcies.
Now the groups are talking, and an accommodation to lower supply may occur imminently. If this happens, the price of oil will jump up. Otherwise it will plummet even further.
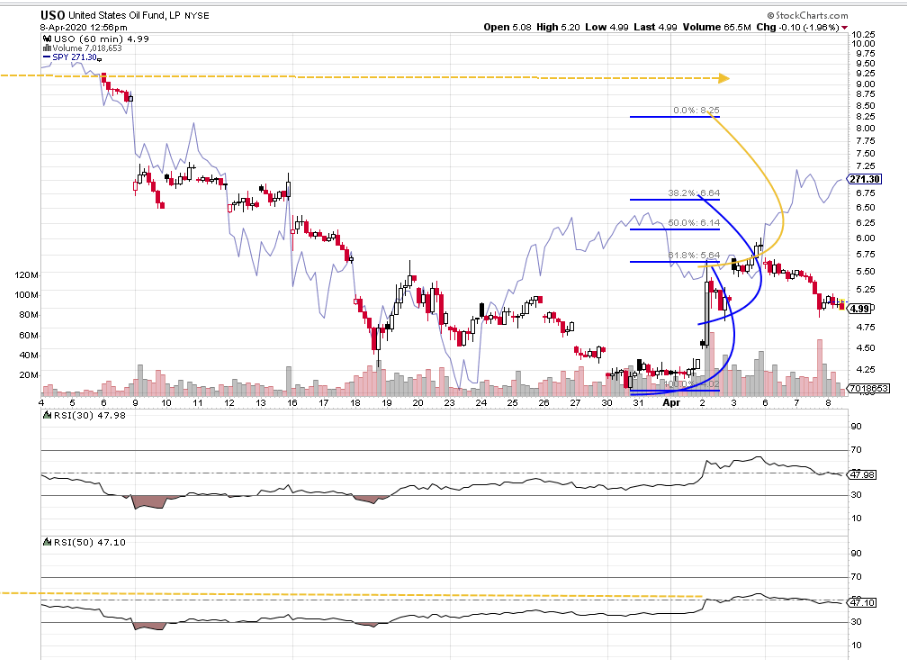
The technicals, shown in the graph above, tell us that the next move will be to the upside. In the chart, a visual trace of the lower lows on price and RSI (relative strength indicator) tell us we have bullish divergence. This means that while prices were making lower lows, they were doing so with decreasing force. The downtrend is running out of steam. This is a sign of a reversal of patterns.
As the fibonacci projections show, we expect a minimum retracement of USO to $6.65 levels. This is because our first wave high was formed with a peak at $5.64, and this wave was subsequently breached. This means we have an excellent change of what I call a mirrored fibonacci rise to %6.64. Statistically, when that happens, the probability of a mirroring effect is around 70%. We may even see a possible recovery all the way to $8.25, but hat likelihood is much lower. An RSI strength trace even suggests a high as much as $9.25. An important gap at $8.74 also begs to be filled. These provide the elements of our bullish trade.
We're going to put on what I've labeled a "lopsided butterfly" trade. This will be fairly neutral to the expected decline in volatility, since it buys and sells options within the same period. It benefits from the passage of time, as shown by the steepening profit lines on the blue dotted line (day of expiration) as opposed to the blue line (interim time point).
click to enlarge
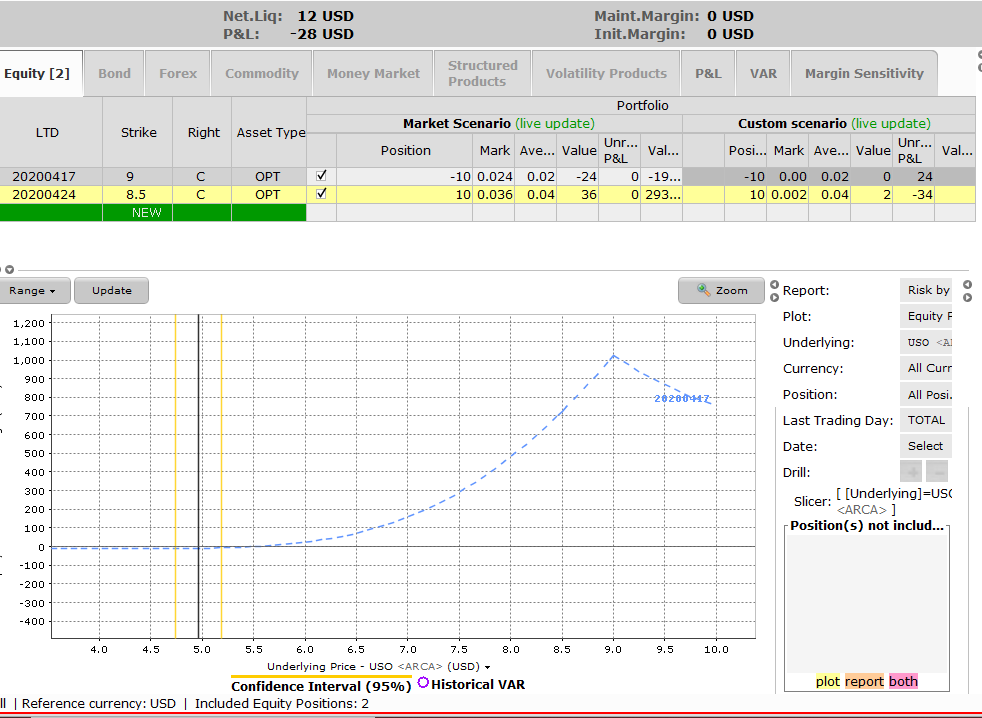
As you can see, this would produce earnings of around $100 for every $12 committed. about an 8-fold return, or a 1:8 risk/reward ratio. That's very compelling.
We're cutting the time period very tightly with this trade, and it may fail for that reason. But we think the producers are desperate for a solution, and will not haggle too long. What if oil does reach the $9.25 range suggested by RSI's by that date? I don't think that is very likely, but it is certainly not in the range of the impossible. That would give us a mind-bending $1000 gain for every $12 put at risk. One can dream...
Those are odds I like. I've put on the position already. So far it's losing money, as oil producers are still bickering. Follow this trade at your own riak, knowing you could lose all your money!
Disclosure: Options investing is inherently risky. This is not a solicitation to buy or sell. Please read our full disclosure on this site.
[print-me target="#post-%ID%"]
[print-me target="#post-%ID%"]