09 July 2021 AD (Anno Domini) - or 7/1/01 PC (Post Covid)
Sorry. I could not resist that irreverent reference to the recent global pandemic. But I believe this is a real global "marking point". History will look back on 2020 as the year a new period in the evolution of mankind. Perhaps something on the lines of what has been labeled "The Fourth Turning".
What can we expect of the next decade? Tremendous, mind-bending technological changes. These will be accompanied by dramatic social and political shifts. Think AI , machine learning and robotics disrupting every industry on the planet, and causing massive job losses and job creation. Will it result in massive unemployment? Perhaps. Perhaps not. But it will dramatically change the very nature of every profession.
The best performing ETF of the last 10 years has been Kathy Wood's ARK Investment Trust (ARKK). This ETF is dedicated to the trends identified above: a rise of new industries and companies that "get" technology and a dramatic fall from grace of industries and companies that scoff at the notion that "this time it's different" and that believe that technological disruptions will be minor.
I've got a whole investment strategy dedicated to buying new tech companies and selling old "dinosaurs", which I've described elsewhere ("see Great Investment Strategies blog). But readers should know my bias: I'm very bullish ARKK in the long term.
I try not to let this bias affect my technical analyses of ARKK, but the reader should be aware of these biases.
Here's where my technical analysis takes ARKK going forward, and two possible trades that can result from it.
click to enlarge
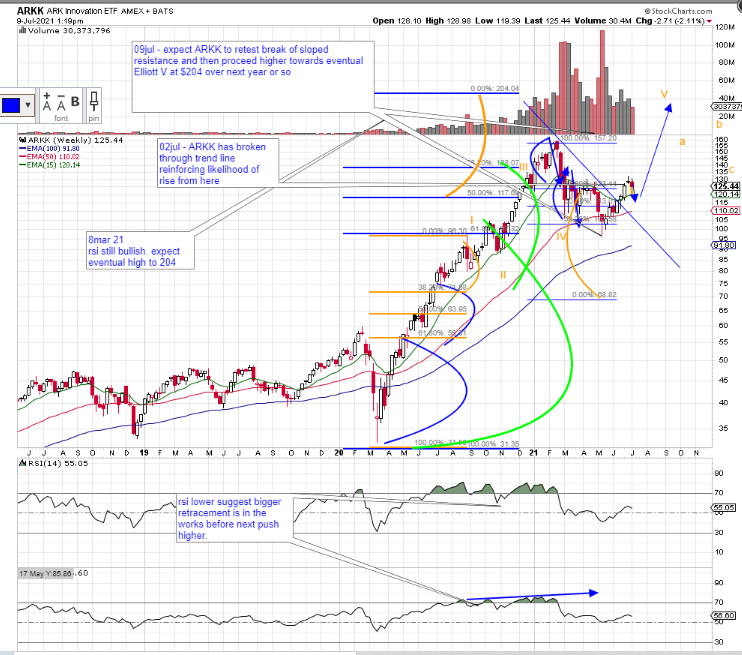
The technicals, shown in the graph above, are based on weekly candles, each bar representing a 1 week period. The green parabolas show the waves I've detected. In the dominant trend, you can expect that if a wave is breached it will make two more commensurate waves, whose peaks can be calculated using fibonacci mathematics.
By my own observations, if the first wave is surpassed, you can expect the next wave to be attained about 70% of the time. The "third" wave is far less likely, around 30% of the time. For it to be attained you must have correctly identified the dominant trend. That's why I color it in orange.
If we are in a dominant upwards trend on ARKK (and not facing a trend reversal) then the price of $204 will be reached. When that happens is more difficult to ascertain, but sometime in mid-2022 seems reasonable.
But what factors (other than my fundamental belief in the underlying trend), make me reject the notion that we're in the midst of a trend reversal that will take ARKK down to $70?
1)Look at the volume of shares traded just prior to the last peak. It increased exponentially from 2020 levels as the price was rising. This is bullish sign. If the trend were reversing, we'd have seen less and less volume of new buyers coming in as the universe of potential buyers became satiated. That did not occur.
2) That is reflected in the 14 period and 30 period RSI indictor Note how on the 14 period line the higher highs created a flat peak even as the stock was rising. This meant that at the peak you already knew than over the next few weeks the security "wanted" to move back down to a price it had reached at the lowest point between those two RSI highs. That was a price of $88. So far the price has moved down to $95.
So shouldn't it still move about still lower? Down to $88? Yes that's a highly likely scenario.
But now look at the higher highs traced by the 30 period (month) RSI. It never sloped down at the time the price was making higher highs. This is critical. It tells you the long term prognosis for this security is still pointed up. (In effect, it's saying the same thing as volume, but just makes it easier to recognize).
But now let's look at a more zoomed in version, using daily charts, to seek more evidence. Here it is.
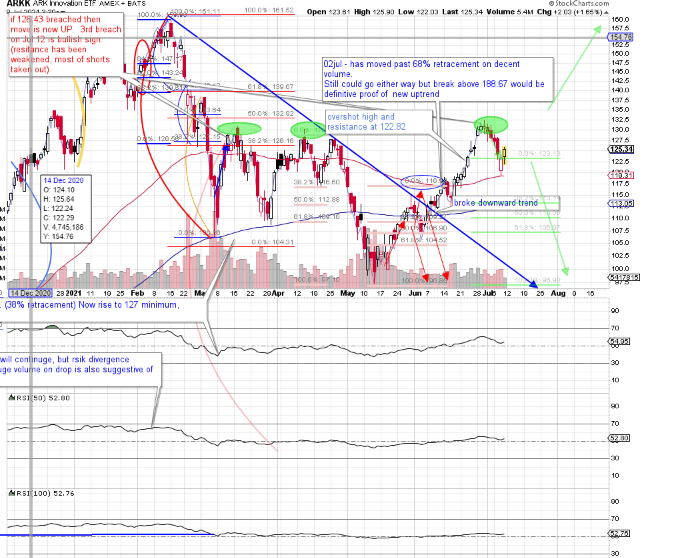
1) Look at the lows reached in March and May, then trade down to the corresponding RSI 50 lines. The second RSI low is higher than the first. That's "bullish divergence" between price action and RSI action. It suggests that the security will start moving up and that the trend is reversing.
2) Also an RSI trace at that point suggests the stock will need to reach "at least" a level of $139. It may then move higher or lower.
3) Finally look at the highs made since March, April ,May and then July. On three occasions the market tested resistance around 130 and the resistance held. Then just recently , in July that resistance was again tested, and this time a slight new high was reached. This was not on huge volume, so it's not yet definitive.
4) Overall, we're still locked in a range between $132.50 and $108. Short term (hourly) charts make me believe we'll move lower than $119. A mirroring effect would then bring it to $111, at a minimum.
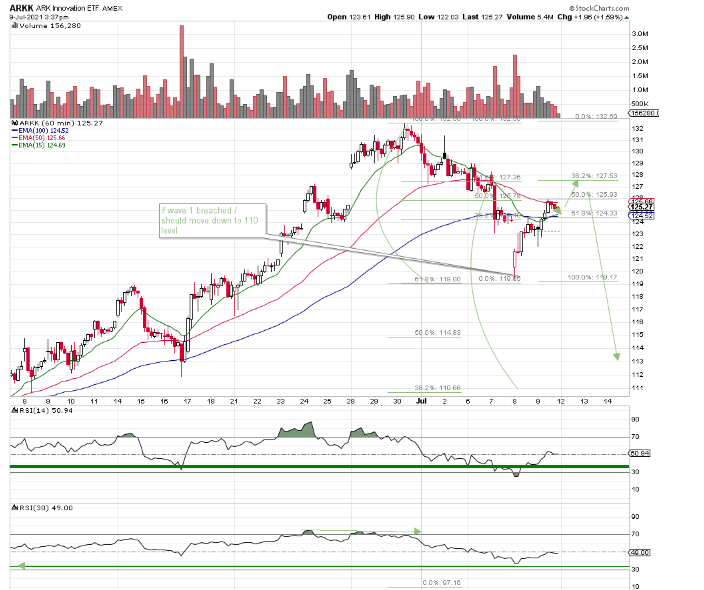
So what's the final prognosis? I see ARKK moving down to $111 in the short term, eventually retesting the $105 resistance.
There are good odds it will retest the $86 floor established last November. From there the move will be up.
So swing traders can short ARKK here with a tight "mental" stop about $3 to $4.00 above recent highs. (I NEVER set stop limit orders which market makers and level II traders can see. You're just a sitting duck for smart scalpers engaging in almost riskless arbitrage. Why $3 to $4 above the high? Too many others set their stops a few pennies above the recent high. Inevitably they get taken out by day traders. )
Buy back most of the shares at $97, and leave a few riding down to $87, when you should sell them all. For each share, you'd be risking about $10 to make $30-45. Those are 3 to 1 odds, not too bad.
Option traders can do even better, using a calendar, as follows:
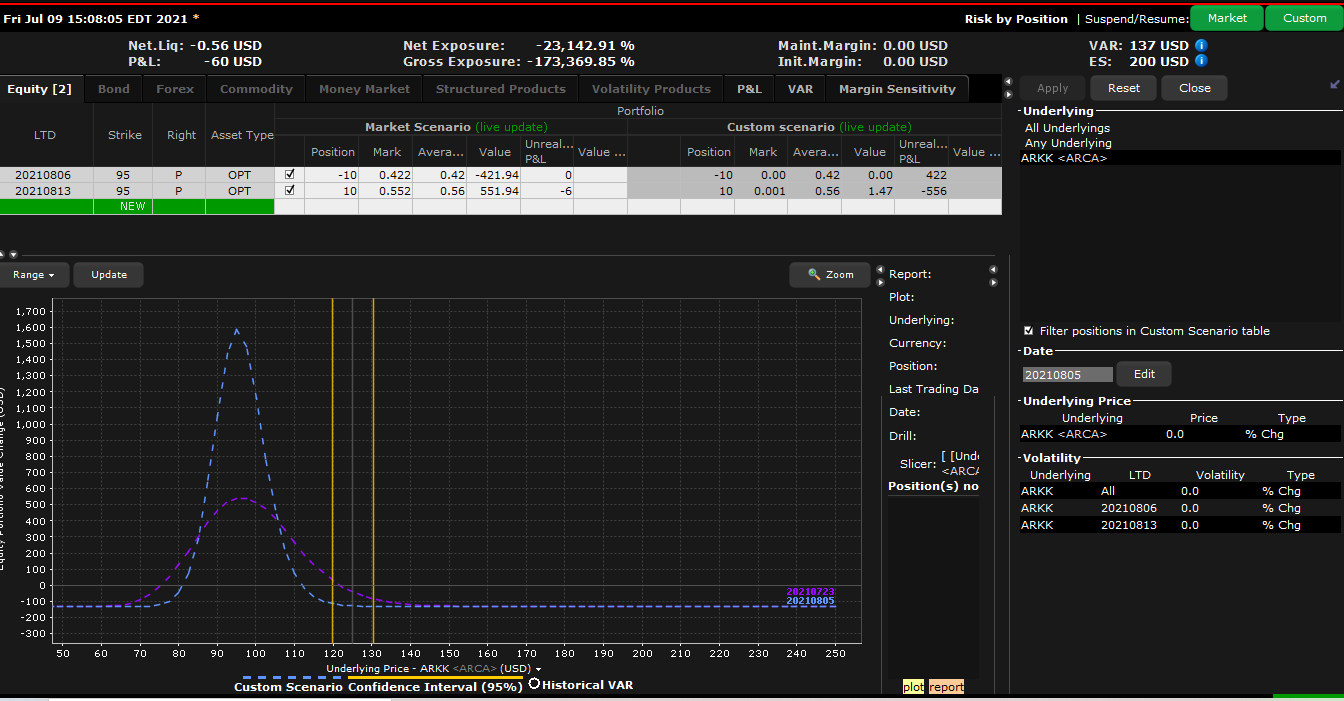
Sell 10 AUG 6 95 PUTS
Buy 10 AUG 13 95 PUTS
This should be placed as a limit order: pay no more than $0.17 per share or $1.70 for $10 contracts. Your risk is then $170 if the security never moves down. Two weeks from today your maximum gain would be around $450, but if you are patient (time works in your favor), at expiration of the inner leg on Aug 6, you could have maximum gains of $1600.
We'll put this trade on ourselves, and talk to you in a few weeks. We'll be putting on another series of smaller weekly options trade centered on this analysis, risking about $50 to $100 on each occasion. Interested viewers should click on our Option Jolts for detailed information on how to participate.
Added on July 14, 2021 - ARKK moved down to 114.20 low. We chose to take profits by selling for combined premiums of $3.20 x 10 shares. This was a profit of $106.00 on each share, or $1060.00 for all 10 contracts. I chose to sell because intraday the stock had started to make higher highs on the 15 minute candles, and showed a temporary bullish divergence that could mean it would still be at a higher level when my inner sold put expired. At that point I would be facing rapid time decay and would lose a lot of premium if the stock were to continue moving up.
Remember the market adage: "Bulls make money, bears make money, pigs get slaughtered". In hindsight, this proved to be the right decision, as ARKK moved higher over the next two weeks.
Disclosure: Options investing is inherently risky. This is not a solicitation to buy or sell. Please read our options disclaimer on this site before trying to emulate any trade shown here.
[print-me target="#post-%ID%"]