Summer Doldrums 2015
The last few weeks have seen the market give back all of its gains for 2015, causing a number of our clients to ask if this was "the big one". My belief in short, is no, but I do expect a "normal" correction after 6 years of a steadily rising bull market.
The fundamental reasons are numerous:
- China's growth is lagging seriously, down from levels in the mid teens to levels of around 7%
- China's recent devalution is likely to set off a beggar-thy-neighbor currency war among raw-materials exporters in the emerging world, to the detriment of all.
- 6 years of slow, painful recovery have still not brought US employment levels back to pre-recession levels, and the average middle class consumer is still "tapped out".
- Corporate profits among US companies are starting to decline. Most corporations prefer to invest cash in share buybacks and mergers and acquisitions, instead of investments in capital and technology. This is a sure sign of a lack of confidence in the robustness of consumer spending.
- The glut of oil in the world has sent oil prices down 50%. While good for consumers, it has provoked a serious macro-economic and geopolitical re-shuffling of the deck, increasing market uncertainty.
- The FED is considering raising interest rates to dampen hidden inflation, and this is scaring both bond and stock markets. Will they end up raising rates? The majority of economists think yes, but for me, the verdict is still out. I believe we will see a further dramatic decline in oil prices, which will lessen the risks of inflation.
So there are numerous real world reasons for this stock market to correct down.
But let's also look at technical factors. Stocks do move on fundamental intrinsic values in the long run, but they move on mass psychology in the short term. This mass psychology tends to move in wave patterns that correspond eerily closely to the mathematics developed by 12th century mathematician Leonardo Bonacci, known more commonly as Fibonacci numbers.
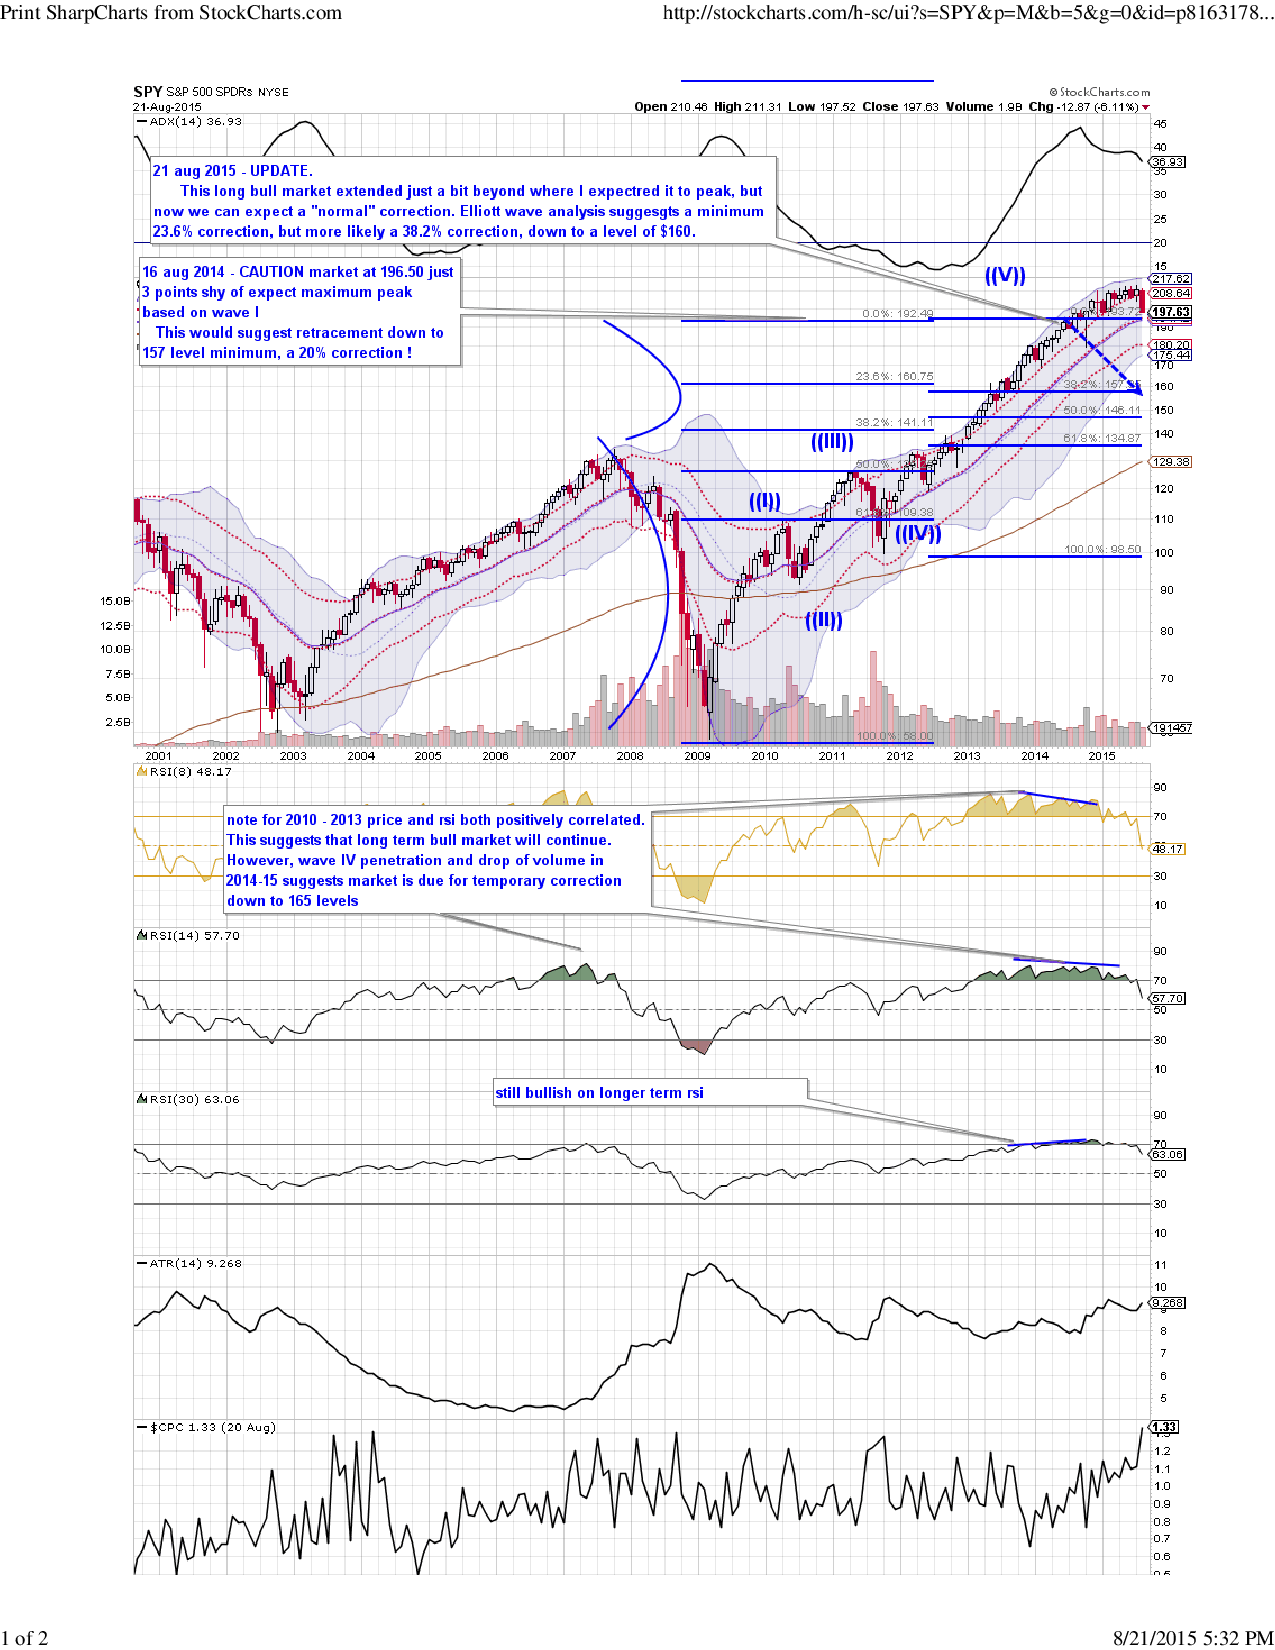
So back in August I was expecting the SPY to peak at 197.08. The actual peak was 4 points higher at 201.90, or off by 2 percent. From there, a retracement of 23.6% occurs over 90 percent of the time, and a retracement of at least 38.2% occurs around 80% of the time. Stocks can drop lower than that but those are the most common levels.
Take a look at the following 2 graphs, one showing a monthly view (each candle represents one month), the other a weekly view, for more detail.
click to enlarge
This graph shows that I've been expecting a correction for almost a year now, and in fact the peak on SPY extended 10% more than I expected. Now, however, I believe the bullish three year upwave is finally ending.
click to enlarge
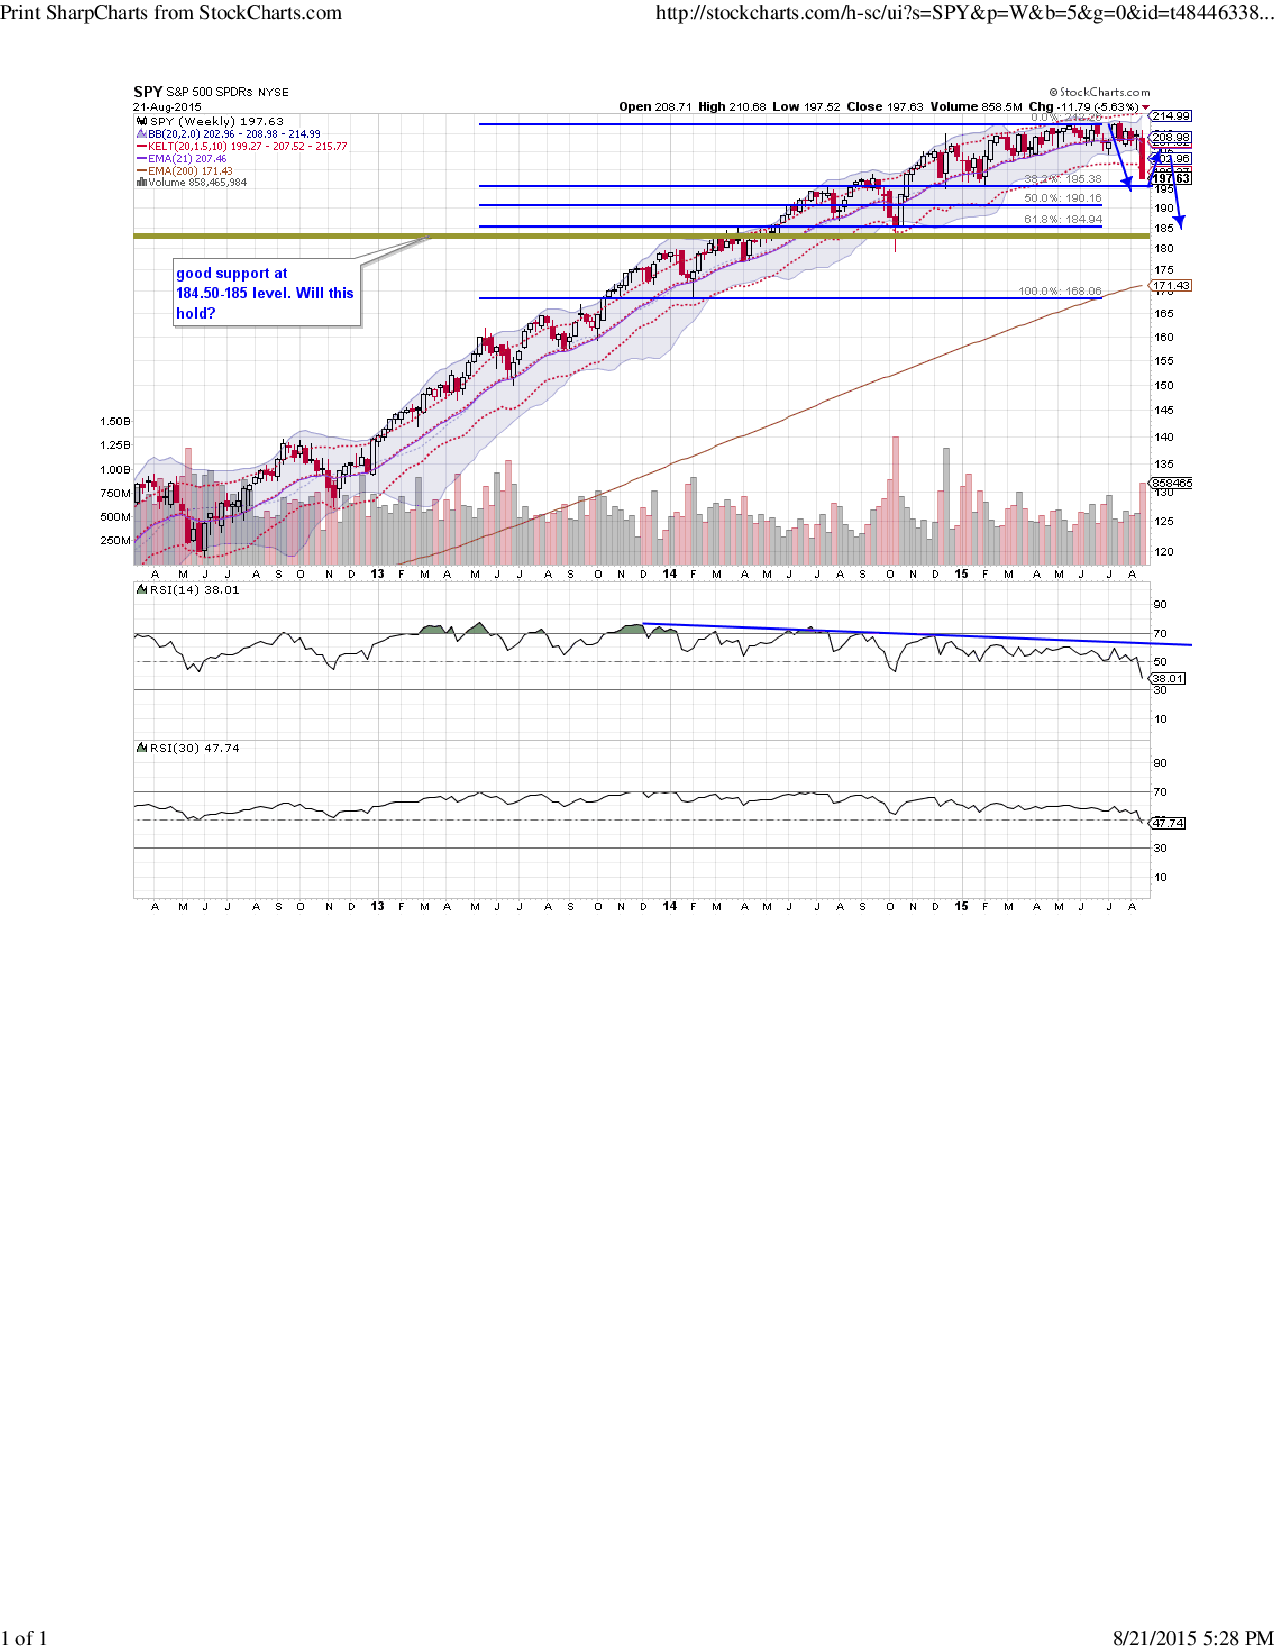
Elliot wave technicians will tell you that after the 5th Elliot wave pattern peaks, in this case at $217.92 , it is common to see a downward retracement in a zigzag formation (ABC pattern) that retraces down 61.8%. This would take us all the way down to a level of around $120.
That dramatic drop is certainly possible, but I do not believe it is likely to happen. Note how our price and RSI slopes only diverge on the short term but on the longer term (30 period) RSI chart they are both sloping upwards, in a pattern of bullish convergence. This leads me to conclude that the market will find ultimate support at $185 level. That would only be a retracement of about 18% off of the highs, which is very rare in Elliot wave patterns. Elliot wave theory would ascribe a minimum drop of 23.6% or around $175.
As we get closer to those levels, we will need to take a look at volume and rsi measurements, and make a new determination. And of course technical waves just measure probabilities, not certainties. But when bother the fundamentals and the technicals point down, the wise investor will take defensive measures.