How Low Will We Go?
The recent market drops have caused a number of my clients to inquire how severe a market drop I was expecting.
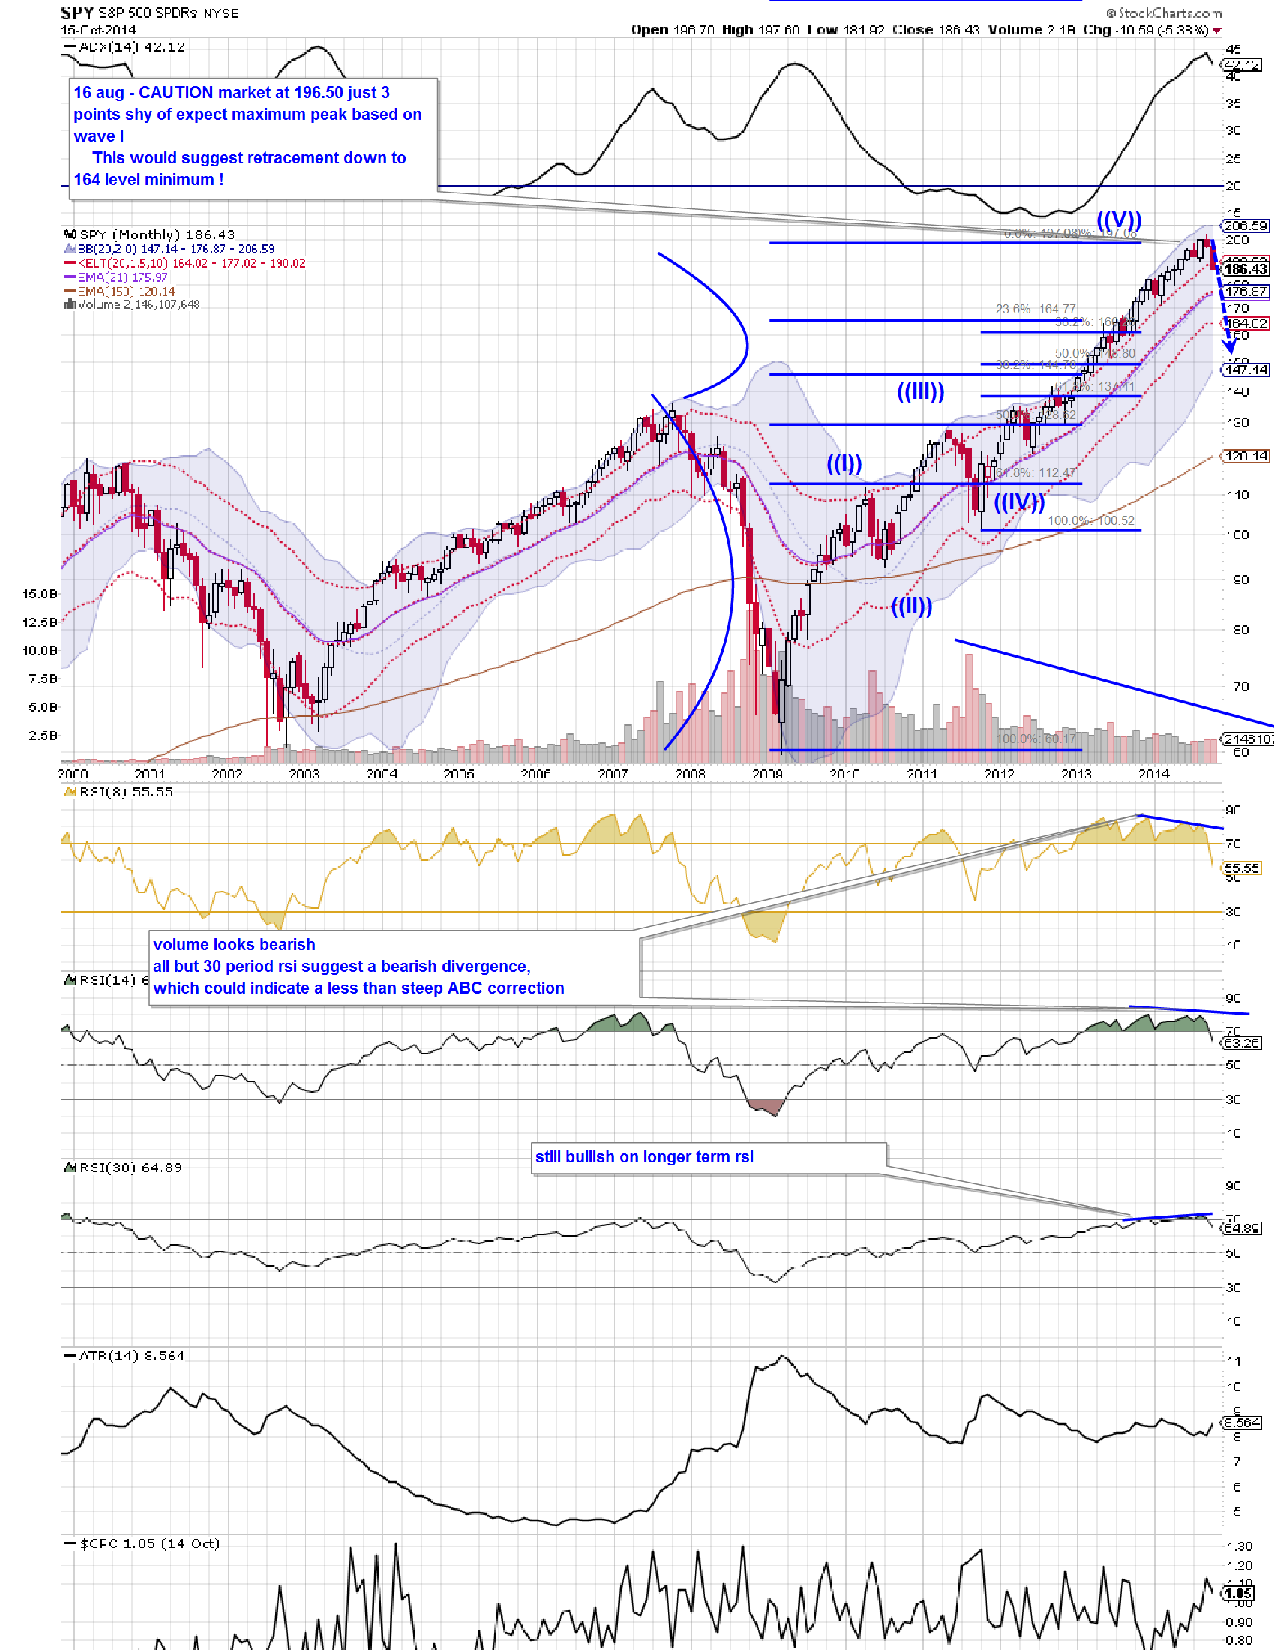
The chart below shows my thinking back on August 19, and not much has changed since then.
click to enlarge
Stocks do move on fundamental intrinsic values in the long run, but they move on mass psychology in the short term. This mass psychology tends to move in wave patterns that correspond eerily closely to the mathematics developed by 12th century mathematician Leonardo Bonacci, known more commonly as Fibonacci numbers.
So back in August I was expecting the SPY to peak at 197.08. The actual peak was 4 points higher at 201.90, or off by 2 percent. From there, a retracement of 23.6% occurs over 90 percent of the time, and a retracement of at least 38.2% occurs around 80% of the time. Stocks can drop lower, than that but those are the most common levels. Accordingly, I would expect a minimum drop to the $165 (23.6% retracement) but more likely also down to $145. The first represents a correction of 18% off of the peak, the second a drop of 28%.
Of course, stock technicians know that after the 5th Elliot wave pattern peaks, in this case at $201 , it is common to see a downward retracement in a zigzag formation (ABC pattern) that retraces down 68.2%. This would take us all the way down to a level of around $112, or a 55% drop from the peak.
That dramatic drop is certainly possible, but I do not believe it is likely to happen. Note how our price and RSI slopes only diverge on the short term but on the longer term (30 period) RSI chart they are both sloping upwards, in a pattern of bullish convergence. This leads me to conclude that the market will find ultimate support at $145 level, then move higher from there.
Of course technical waves just measure probabilities, not certainties. But investors would be wise to batten down the hatches!