What’s With The Skimpy Portfolio

A number of my readers have commented on the few stocks featured in our portfolio. Let me explain that.

I follow and track hundreds of stocks that meet my quality criteria, but I believe excellent results can be obtained with very few stocks. I am currently deploying three different trading strategies, one of which is posted here.

It consists of using daily time periods as the units of measurement (referred to as "candles" in technical jargon). Basically I am relying on specific technical indicators to provide me with a signal as to when to go long or when to go short.

This particular strategy consists of always being in the market in those securities, and never on the sidelines. Hence, there is always money to be made - or lost, as the case may be.

It's easier not to miss signals if you follow fewer stocks.

I have another portfolio which deploys the same strategy, but does so on up to 20 stocks at a time. In principal, this should smooth out the results, and give me more consistent results. I'll be posting that strategy online a little down the road.

Keeping this blog up to date takes time, and meanwhile, I've got to run my business.
BIDU – Wrapping Up The Trade

A quick followup on my two previous trade posts related to BIDU.

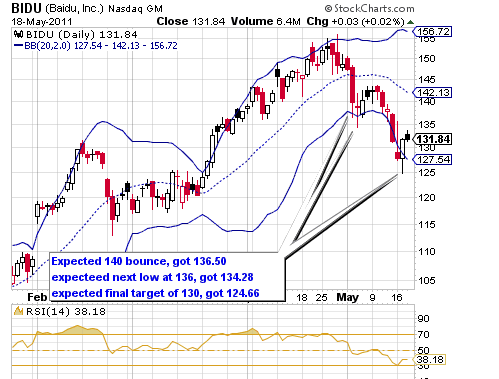
Based on divergence of the price and rsi and stochastics, we felt the stock was due for a correction. Using Elliott Wave analysis and resistance points, we expect a correction down to 140, then 136, with an ultimate target of 130.

We were wrong on the exact areas at which the price bounced, but we nailed the general trend. We held on all the way down a little past our target, 130. The stop actually went all the way down to 124.66, but we did not get that exit price. We exited at 127.40. Based on our original price of 145.71, published on April 15, we made 12.5%. Not bad for a few minutes of monitoring each day, and a month's patience.

By the way, we later re-established a position shorting BIDU. Based on our analysis of RSI strengths and resistance levels, we believe the stock will finally settle around $100. We expect at least one large bounce in between, at the 120 level.

This trade shows the importance of paying attention to technicals, but not putting too much credence in their precision. The Elliott Wave pattern worked, but it did not conform to a strict Fibonacci sequence. Resistance levels such as floors and ceilings should be taken loosely, not tightly. Thus we will not be surprised if BIDU later bounces at 97, and not at the 100 we predict. If that 3 percent difference makes or breaks your profitability, you should not take the trade in the first place.

As always, please read our disclaimer.

Technicals on the Wilshire Look Scary

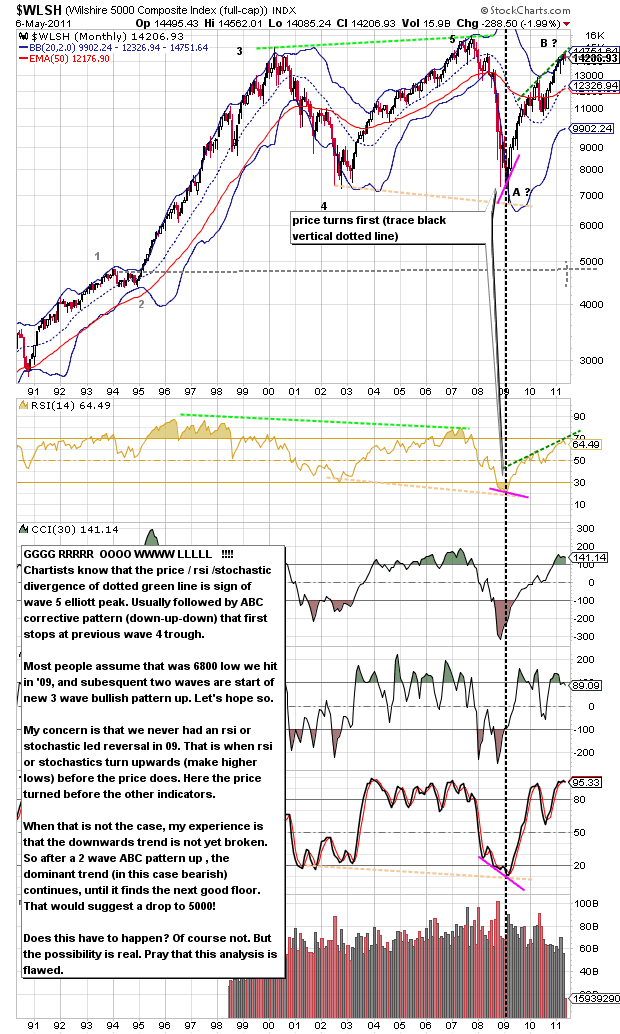
I seriously doubt there are any buy-and-holders on this web site, but in case one of you landed here by accident, and, shell-shocked, is looking about himself or herself in complete bewilderment, this chart will give you something to ponder.

Wilshire Tchnicals

Of course those of us who are traders don't have to worry to much about the big picture. We react to the charts. We buy when they tell us to do so, and sell short when so ordered. For a take on some of the fundamental forces that would explain why such a cataclysmic event could happen, check out the following scenario painted by Harry S. Dent. For 20 years considered a perma-bull, after successfully predicting the last two long term bull markets, Mr Dent is now calling for a precipitous drop in all markets. In fact, he foresses a great depression. The MadHedgeFundTrader's blog explains Mr Dent's views nicely. Definitely worth the read.

Have a productive trading week.

BIDU short – A Followup

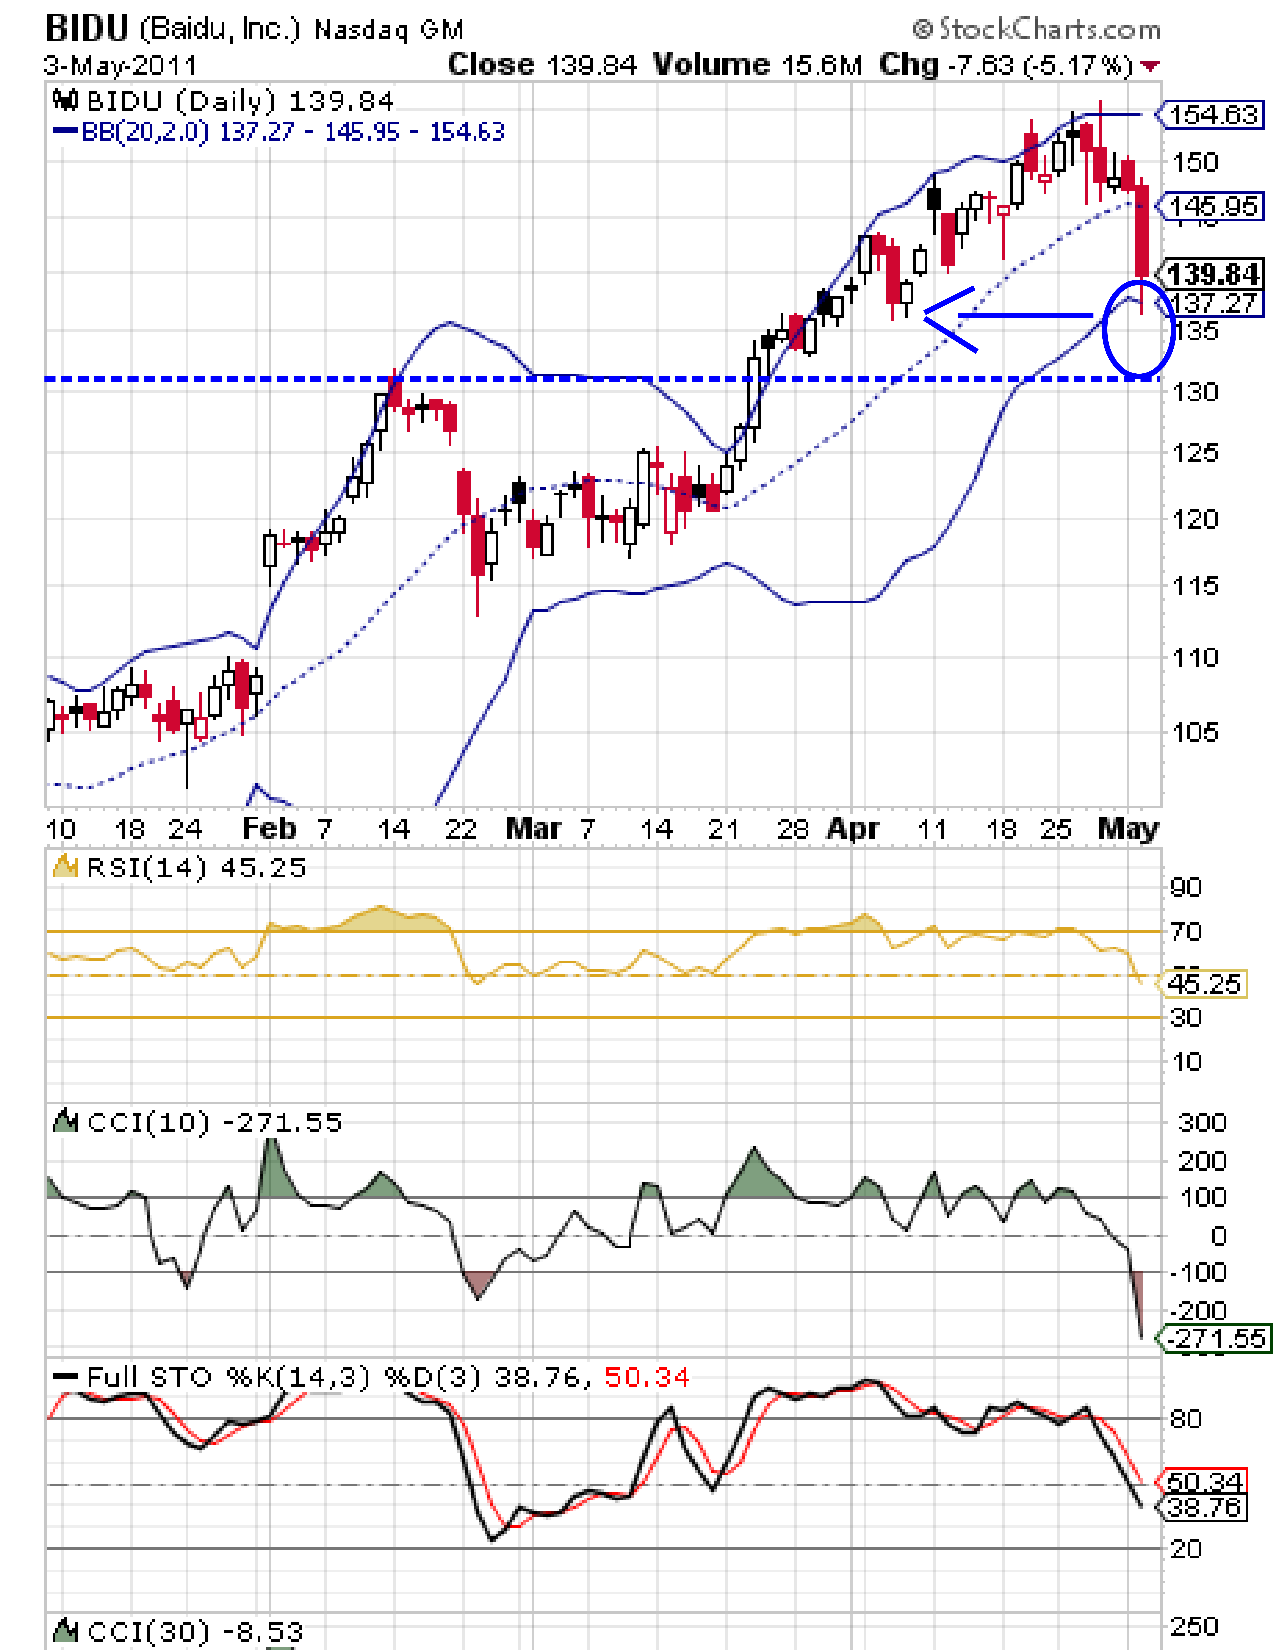
If you read my previous post, you know we were shorting BIDU, the dominant Chinese internet search engine, against its dominant trend.

Based on divergence of the price and rsi and stochastics, we felt the stock was due for a correction. Using Elliott Wave analysis and resistance points, we expect a correction down to 140, then 136.

How did we do? Well, we were right enough, although some of you were gleefully predicting our imminent capitulation as BIDU proceeded higher initially. Bidu dropped to 142, then 136.50, just a whisker away from our prediction of 136. It ticked back up to 142 and is headed back down but finding resistance at 140.

That's only 2.8% in two weeks. But hey, that's still over 50% a year. You can't always have steak. Sometimes mashed potatoes will have to do!

Besides there's still an excellent chance for the stock to move on the next stair down, my 130 target. Then my mashed potatoes would be become a "gratin de pommes au four", if you'll pardon my stretching the metaphor a bit.